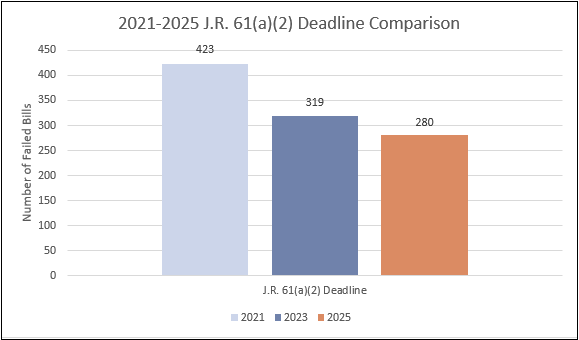
280 Bills failed to pass the deadline this year while 319 Bills failed this same deadline in 2023 and 423 Bills failed in 2021. To control for our totals, this represents 15.5% failure rate (of 1802 Fiscal Bills) this year, 14.9% failure rate (of 2136 Fiscal Bills) in 2023, and 21.0% failure rate (of 2019 Fiscal Bills) in 2021. Looks like a steady trend of fewer bills failing this deadline with some consistency around 15% of measures failing.
The next deadline will occur this Friday, requiring all Non-Fiscal Bills to be out of their policy Committees and move on to the Floor. We’ll have the bills which fail marked 2-Year on Tuesday and have another comparison graph ready next Thursday. Keep an eye out!